When we work with other people’s data, we often have to struggle through multiple unexpected steps before we get to a flexible, usable structure. Popular ways of structuring and presenting data can place content beyond the reach of code-based routines to tackle repetitive tasks efficiently.
Package functions
The functions in unheadr help us rework data shared by
other people, from a human-readable structure to a tidier
machine-readable structure on which we can perform common data
manipulation tasks.
Data frames and tibbles
Here is how unheadr works with tibble and data frame
objects that suffer from common issues such as:
- Embedded subheaders
- Broken values
- Merged cells and values wrapped within columns
- Broken rows
- Broken headers
Embedded subheaders are usually grouping variables embedded into another variable, used to show hierarchical data or create small multiples of data.
A simple example would be a coffee shop menu:
dat <- data.frame(
  drink = c(
    "Cold Drinks", "Soda", "Water", "Juice", "Lemonade",
    "Hot Drinks", "Tea", "Coffee"
  ),
  price = c(NA, 2.99, 1.99, 3.15, 2, NA, 3.99, 1.99), stringsAsFactors = FALSE
)

dat
#>         drink price
#> 1 Cold Drinks    NA
#> 2        Soda  2.99
#> 3       Water  1.99
#> 4       Juice  3.15
#> 5    Lemonade  2.00
#> 6  Hot Drinks    NA
#> 7         Tea  3.99
#> 8      Coffee  1.99
The beverage type is embedded in the ‘drinks’ variable. If we can
match them with regular expressions, we can move the grouping values
into their own variable using untangle2()
untangle2(dat, "Drinks$", drink, "beverage_type")
#> 2 matches
#>      drink price beverage_type
#> 1     Soda  2.99   Cold Drinks
#> 2    Water  1.99   Cold Drinks
#> 3    Juice  3.15   Cold Drinks
#> 4 Lemonade  2.00   Cold Drinks
#> 5      Tea  3.99    Hot Drinks
#> 6   Coffee  1.99    Hot Drinks
Broken values usually happen when we’re pressed for space.
For whatever reason, the entries for the Barcelona 1992 and London 2012 Olympics are broken across two contiguous rows and NAs are used as padding in the other variables.
OGames <- tibble(
  Games = c("Los Angeles 1984", "Barcelona", "1992", "Atlanta 1996", "Sydney 2000", "London", "2012"),
  Country = c("USA", "Spain", NA, "USA", "Australia", "UK", NA),
  Soccer_gold_medal = c("France", "Spain", NA, "Nigeria", "Cameroon", "Mexico", NA)
)
OGames
#> # A tibble: 7 × 3
#>   Games            Country   Soccer_gold_medal
#>   <chr>            <chr>     <chr>
#> 1 Los Angeles 1984 USA       France
#> 2 Barcelona        Spain     Spain
#> 3 1992             NA        NA
#> 4 Atlanta 1996     USA       Nigeria
#> 5 Sydney 2000      Australia Cameroon
#> 6 London           UK        Mexico
#> 7 2012             NA        NA
In this case, we can use unbreak_vals() to ‘unbreak’ the
lines in the ‘Games’ variable, matching the strings that start with
numbers.
OGames %>%
  unbreak_vals("^[0-9]", Games, Games_unbroken, slice_groups = TRUE) %>%
  select(Games_unbroken, everything())
#> Warning: argument slice_groups is deprecated; extra rows and the variable with
#> broken values are now dropped by default.
#> # A tibble: 5 × 3
#>   Games_unbroken   Country   Soccer_gold_medal
#>   <chr>            <chr>     <chr>
#> 1 Los Angeles 1984 USA       France
#> 2 Barcelona 1992   Spain     Spain
#> 3 Atlanta 1996     USA       Nigeria
#> 4 Sydney 2000      Australia Cameroon
#> 5 London 2012      UK        Mexico
Wrapped columns often happen when we merge cells in spreadsheets or use table formatting in a word processor, resulting in empty or NA values used to pad all the vertical space.
knicks <- data.frame(
  stringsAsFactors = FALSE,
  player = c("Allan Houston", NA, "Latrell Sprewell", NA, NA),
  teams = c(
    "Pistons", "Knicks", "Warriors", "Knicks",
    "Timberwolves"
  ),
  position = c("Shooting guard", NA, "Small forward", NA, NA)
)
knicks
#>             player        teams       position
#> 1    Allan Houston      Pistons Shooting guard
#> 2             <NA>       Knicks           <NA>
#> 3 Latrell Sprewell     Warriors  Small forward
#> 4             <NA>       Knicks           <NA>
#> 5             <NA> Timberwolves           <NA>
We can unwrap the ‘teams’ values into a single string using
unrwap_cols().
knicks %>% unwrap_cols(groupingVar = player, separator = ", ")
#> # A tibble: 2 × 3
#>   player           teams                          position
#>   <chr>            <chr>                          <chr>
#> 1 Allan Houston    Pistons, Knicks                Shooting guard
#> 2 Latrell Sprewell Warriors, Knicks, Timberwolves Small forward
This is more or less the opposite to separate_rows()
from tidyr.
Line breaks meant to separate values inside a merged cell can be problematic. This often results from parsing tables from PDF or Word documents.
merged_dat <- data.frame(
  stringsAsFactors = FALSE,
  Name = c("Valery V."),
  Asset = c("Apartment\n\nPlot\nHouse\nOther\nApartment"),
  Area = c("45.7\n\n69.2\n65.0\n32.2\n36.9\n\n\n"),
  Status = c("Owned\n\nOwned\nIn use\nUnknown\nOwned\n")
)
merged_dat
#>        Name                                      Asset
#> 1 Valery V. Apartment\n\nPlot\nHouse\nOther\nApartment
#>                                   Area                                   Status
#> 1 45.7\n\n69.2\n65.0\n32.2\n36.9\n\n\n Owned\n\nOwned\nIn use\nUnknown\nOwned\n
To remove duplicated and trailing new line sequences
“\n”, we can use squish_newlines().
merged_dat %>%
  mutate(across(c(Asset:Status), squish_newlines)) %>%
  tidyr::separate_rows(c(Asset:Status), sep = "\n")
#> # A tibble: 5 × 4
#>   Name      Asset     Area  Status
#>   <chr>     <chr>     <chr> <chr>
#> 1 Valery V. Apartment 45.7  Owned
#> 2 Valery V. Plot      69.2  Owned
#> 3 Valery V. House     65.0  In use
#> 4 Valery V. Other     32.2  Unknown
#> 5 Valery V. Apartment 36.9  Owned
In this example, after applying the function across the variables with problematic line breaks it was possible to separate the rows into a tidy structure.
Broken rows have values of two contiguous rows broken up and padded with empty or NA values.
basketball <-
  data.frame(
    stringsAsFactors = FALSE,
    v1 = c(
      "Player", NA, "Sleve McDichael", "Dean Wesrey",
      "Karl Dandleton", "Mike Sernandez",
      "Glenallen Mixon", "Rey McSriff"
    ),
    v2 = c(
      "Most points", "in a game", "55", "43", "41", "111", "109", "104"
    ),
    v3 = c(
      "Season", "(year ending)", "2001", "2000", "2002",
      "2000", "2002", "2001"
    )
  )
basketball
#>                v1          v2            v3
#> 1          Player Most points        Season
#> 2            <NA>   in a game (year ending)
#> 3 Sleve McDichael          55          2001
#> 4     Dean Wesrey          43          2000
#> 5  Karl Dandleton          41          2002
#> 6  Mike Sernandez         111          2000
#> 7 Glenallen Mixon         109          2002
#> 8     Rey McSriff         104          2001
In this case, we can match any value in any variable along the row that has broken values.
unbreak_rows(basketball, "^Most", v2)
#> 1 match
#>                v1                    v2                   v3
#> 1          Player Most points in a game Season (year ending)
#> 2 Sleve McDichael                    55                 2001
#> 3     Dean Wesrey                    43                 2000
#> 4  Karl Dandleton                    41                 2002
#> 5  Mike Sernandez                   111                 2000
#> 6 Glenallen Mixon                   109                 2002
#> 7     Rey McSriff                   104                 2001
Broken headers are variable names broken up across the first few rows.
vehicles <-
data.frame(
  stringsAsFactors = FALSE,
           Vehicle = c(NA, NA, NA, "Truck", "Motorcycle", "Sedan", "Van"),
             Price = c("in","2014",
                       "(local currency)","50000","44000","33000","50000"),
             Color = c(NA, NA, NA, "White", "Black", "Red", "White"),
         Emissions = c("Certificate", NA, NA, "TRUE", "FALSE", "TRUE", "TRUE")
)
vehicles
#>      Vehicle            Price Color   Emissions
#> 1       <NA>               in  <NA> Certificate
#> 2       <NA>             2014  <NA>        <NA>
#> 3       <NA> (local currency)  <NA>        <NA>
#> 4      Truck            50000 White        TRUE
#> 5 Motorcycle            44000 Black       FALSE
#> 6      Sedan            33000   Red        TRUE
#> 7        Van            50000 White        TRUE
Here, the column names are broken. The top three rows (in addition to the column name) contain fragments of the name and should be mashed together column-wise.
The mash_colnames() function makes these many header
rows into column names. The names are broken up across the top three
rows, which goes in to the n_name_rows argument. Unlike
other functions in unheadr, we provide the number of rows
directly, rather than attempt any string matching.
mash_colnames(df= vehicles, n_name_rows = 3, keep_names = TRUE)
#>      Vehicle Price_in_2014_(local currency) Color Emissions_Certificate
#> 4      Truck                          50000 White                  TRUE
#> 5 Motorcycle                          44000 Black                 FALSE
#> 6      Sedan                          33000   Red                  TRUE
#> 7        Van                          50000 White                  TRUE
When importing data with broken headers into R, variable names are not always assigned from the values in top row, leaving us with automatically generated names (e.g. X1, X2, X3, etc.).
vehicles_skip <-
data.frame(
  stringsAsFactors = FALSE,
                X1 = c("Vehicle",NA,NA,NA,"Truck",
                       "Motorcycle","Sedan","Van"),
                X2 = c("Price","in","2014",
                       "(local currency)","50000","44000","33000","50000"),
                X3 = c("Color", NA, NA, NA, "White", "Black", "Red", "White"),
                X4 = c("Emissions","Certificate",NA,
                       NA,"TRUE","FALSE","TRUE","TRUE")
)
vehicles_skip
#>           X1               X2    X3          X4
#> 1    Vehicle            Price Color   Emissions
#> 2       <NA>               in  <NA> Certificate
#> 3       <NA>             2014  <NA>        <NA>
#> 4       <NA> (local currency)  <NA>        <NA>
#> 5      Truck            50000 White        TRUE
#> 6 Motorcycle            44000 Black       FALSE
#> 7      Sedan            33000   Red        TRUE
#> 8        Van            50000 White        TRUE
In this case, the keep_names argument in
mash_colnames() lets us ignore the object names when
building new names from the first four rows of the data.
mash_colnames(df= vehicles_skip, n_name_rows = 4, keep_names = FALSE)
#>      Vehicle Price_in_2014_(local currency) Color Emissions_Certificate
#> 5      Truck                          50000 White                  TRUE
#> 6 Motorcycle                          44000 Black                 FALSE
#> 7      Sedan                          33000   Red                  TRUE
#> 8        Van                          50000 White                  TRUE
Lastly, the sliding_headers argument in
mash_colnames can be used for tables with ragged names, in
which not every column has a value in the very first row. In such cases,
attribution by adjacency is assumed, and when
sliding_headers = TRUE the names are filled row-wise. This
can be useful for tables reporting survey data or experimental designs
in an untidy manner.
survey <-
data.frame(
  stringsAsFactors = FALSE,
                X1 = c("Participant", NA, "12", "34", "45", "123"),
                X2 = c("How did you hear about us?",
                       "TV","TRUE","FALSE","FALSE","FALSE"),
                X3 = c(NA, "Social Media", "FALSE", "TRUE", "FALSE", "FALSE"),
                X4 = c(NA, "Radio", "FALSE", "TRUE", "FALSE", "TRUE"),
                X5 = c(NA, "Flyer", "FALSE", "FALSE", "FALSE", "FALSE"),
                X6 = c("Age", NA, "31", "23", "19", "24")
)

survey
#>            X1                         X2           X3    X4    X5   X6
#> 1 Participant How did you hear about us?         <NA>  <NA>  <NA>  Age
#> 2        <NA>                         TV Social Media Radio Flyer <NA>
#> 3          12                       TRUE        FALSE FALSE FALSE   31
#> 4          34                      FALSE         TRUE  TRUE FALSE   23
#> 5          45                      FALSE        FALSE FALSE FALSE   19
#> 6         123                      FALSE        FALSE  TRUE FALSE   24
mash_colnames(survey,2,keep_names = FALSE,sliding_headers = TRUE, sep = "_")
#>   Participant How did you hear about us?_TV
#> 3          12                          TRUE
#> 4          34                         FALSE
#> 5          45                         FALSE
#> 6         123                         FALSE
#>   How did you hear about us?_Social Media How did you hear about us?_Radio
#> 3                                   FALSE                            FALSE
#> 4                                    TRUE                             TRUE
#> 5                                   FALSE                            FALSE
#> 6                                   FALSE                             TRUE
#>   How did you hear about us?_Flyer Age
#> 3                            FALSE  31
#> 4                            FALSE  23
#> 5                            FALSE  19
#> 6                            FALSE  24
Spreadsheets
unheadr also includes a function for flattening font and
cell formatting in spreadsheet files into character strings in the
corresponding cell.
Supported formatting:
- bold text
- colored text
- italic text,
- text with strikethrough
- underlined text
- double underlined text
- cell highlighting
One of the example files bundled with unheadr looks like
this:
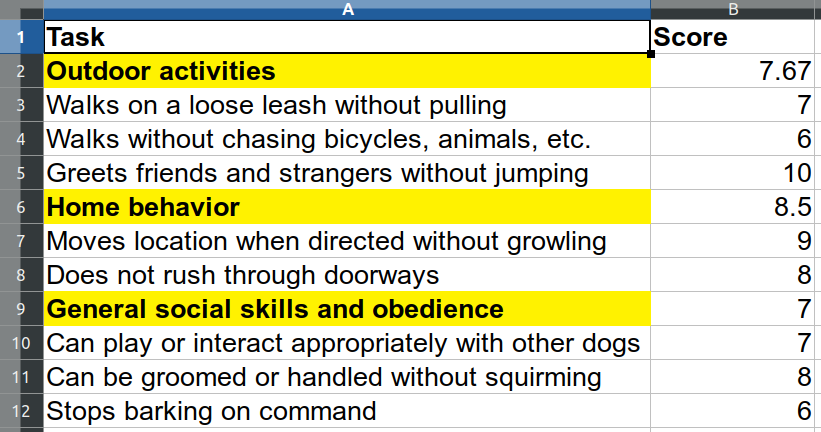
Font formatting and cell highlighting is being used to label an
embedded grouping variable (meaningful formatting). The
annotate_mf() function flattens the formatting into a
character string describing the formatting. The hex8 code of the colors
used for cell or text highlighting is also included.
example_spreadsheet <- system.file("extdata/dog_test.xlsx", package = "unheadr")
annotate_mf(example_spreadsheet, orig = Task, new = Task_annotated)
#> # A tibble: 11 × 3
#>    Task                                               Task_annotated       Score
#>    <chr>                                              <chr>                <dbl>
#>  1 Outdoor activities                                 (bold, highlight-FF…  7.67
#>  2 Walks on a loose leash without pulling             Walks on a loose le…  7
#>  3 Walks without chasing bicycles, animals, etc.      Walks without chasi…  6
#>  4 Greets friends and strangers without jumping       Greets friends and … 10
#>  5 Home behavior                                      (bold, highlight-FF…  8.5
#>  6 Moves location when directed without growling      Moves location when…  9
#>  7 Does not rush through doorways                     Does not rush throu…  8
#>  8 General social skills and obedience                (bold, highlight-FF…  7
#>  9 Can play or interact appropriately with other dogs Can play or interac…  7
#> 10 Can be groomed or handled without squirming        Can be groomed or h…  8
#> 11 Stops barking on command                           Stops barking on co…  6
To apply this approach to all cells in a spreadsheet, we call
annotate_mf_all(). In this other bundled example file,
negative values (first quarter losses) are indicated by bold.
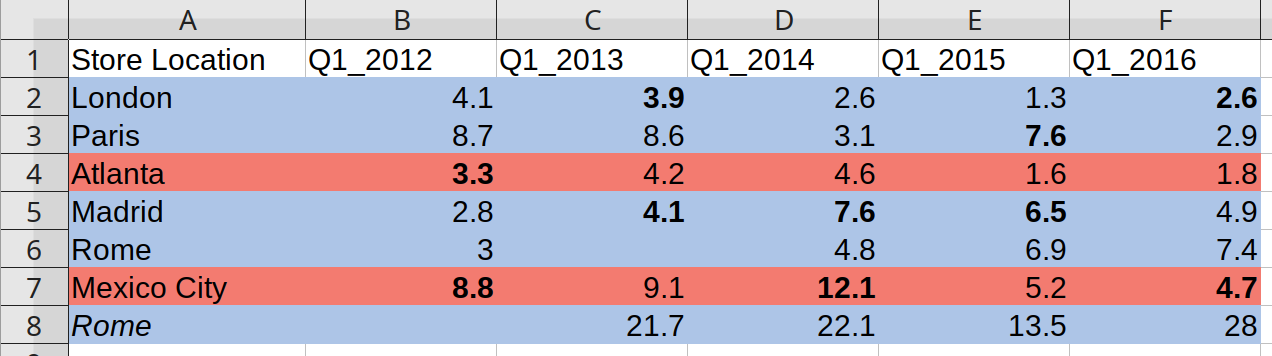
example_spreadsheetb <- system.file("extdata/boutiques.xlsx", package = "unheadr")
annotate_mf_all(example_spreadsheetb)
#> # A tibble: 7 × 6
#>   `Store Location`                  Q1_2012      Q1_2013 Q1_2014 Q1_2015 Q1_2016
#>   <chr>                             <chr>        <chr>   <chr>   <chr>   <chr>
#> 1 (highlight-FFADC5E7) London       (highlight-… (bold,… (highl… (highl… (bold,…
#> 2 (highlight-FFADC5E7) Paris        (highlight-… (highl… (highl… (bold,… (highl…
#> 3 (highlight-FFF37B70) Atlanta      (bold, high… (highl… (highl… (highl… (highl…
#> 4 (highlight-FFADC5E7) Madrid       (highlight-… (bold,… (bold,… (bold,… (highl…
#> 5 (highlight-FFADC5E7) Rome         (highlight-… (highl… (highl… (highl… (highl…
#> 6 (highlight-FFF37B70) Mexico City  (bold, high… (highl… (bold,… (highl… (bold,…
#> 7 (highlight-FFADC5E7, italic) Rome (highlight-… (highl… (highl… (highl… (highl…
Character vectors
Tables from PDF or other similar sources can often be imported into R
as character vectors with one element for each line. These can then be
parsed as fixed width files or separated into columns.
unheadr now includes the regex_valign()
function for aligning elements in these vectors vertically by inserting
padding whitespace (and optional separators) at positions along each
line matched by a regular expression.
This example is based on how data on hotel guests (ID, State of
Origin, and Date) in a PDF is parsed by
pdftools::pdf_text.
guests <-
  unlist(strsplit(c("6     COAHUILA        20/03/2020
712        COAHUILA             20/03/2020"),"\n"))

guests
#> [1] "6     COAHUILA        20/03/2020"
#> [2] "712        COAHUILA             20/03/2020"
There is inconsistent whitespace between the first and second data ‘columns’. With a regular expression that matches a word boundary and uppercase letters, we can adjust the whitespace so that the matched positions are the same across lines.
regex_valign(guests, "\\b(?=[A-Z])")
#> [1] "6          COAHUILA        20/03/2020"
#> [2] "712        COAHUILA             20/03/2020"
This output is easier to parse with readr or other
data-munging approaches.
Further reading
The underlying reasoning, background, and possible uses of
unheadr are described in this publication:
Verde Arregoitia, L. D., Cooper, N., D’Elía, G. (2018). Good practices for sharing analysis-ready data in mammalogy and biodiversity research. Hystrix, the Italian Journal of Mammalogy, 29(2), 155-161. Open Access, 10.4404/hystrix-00133-2018.